

Statistics
Get player statistics from a match
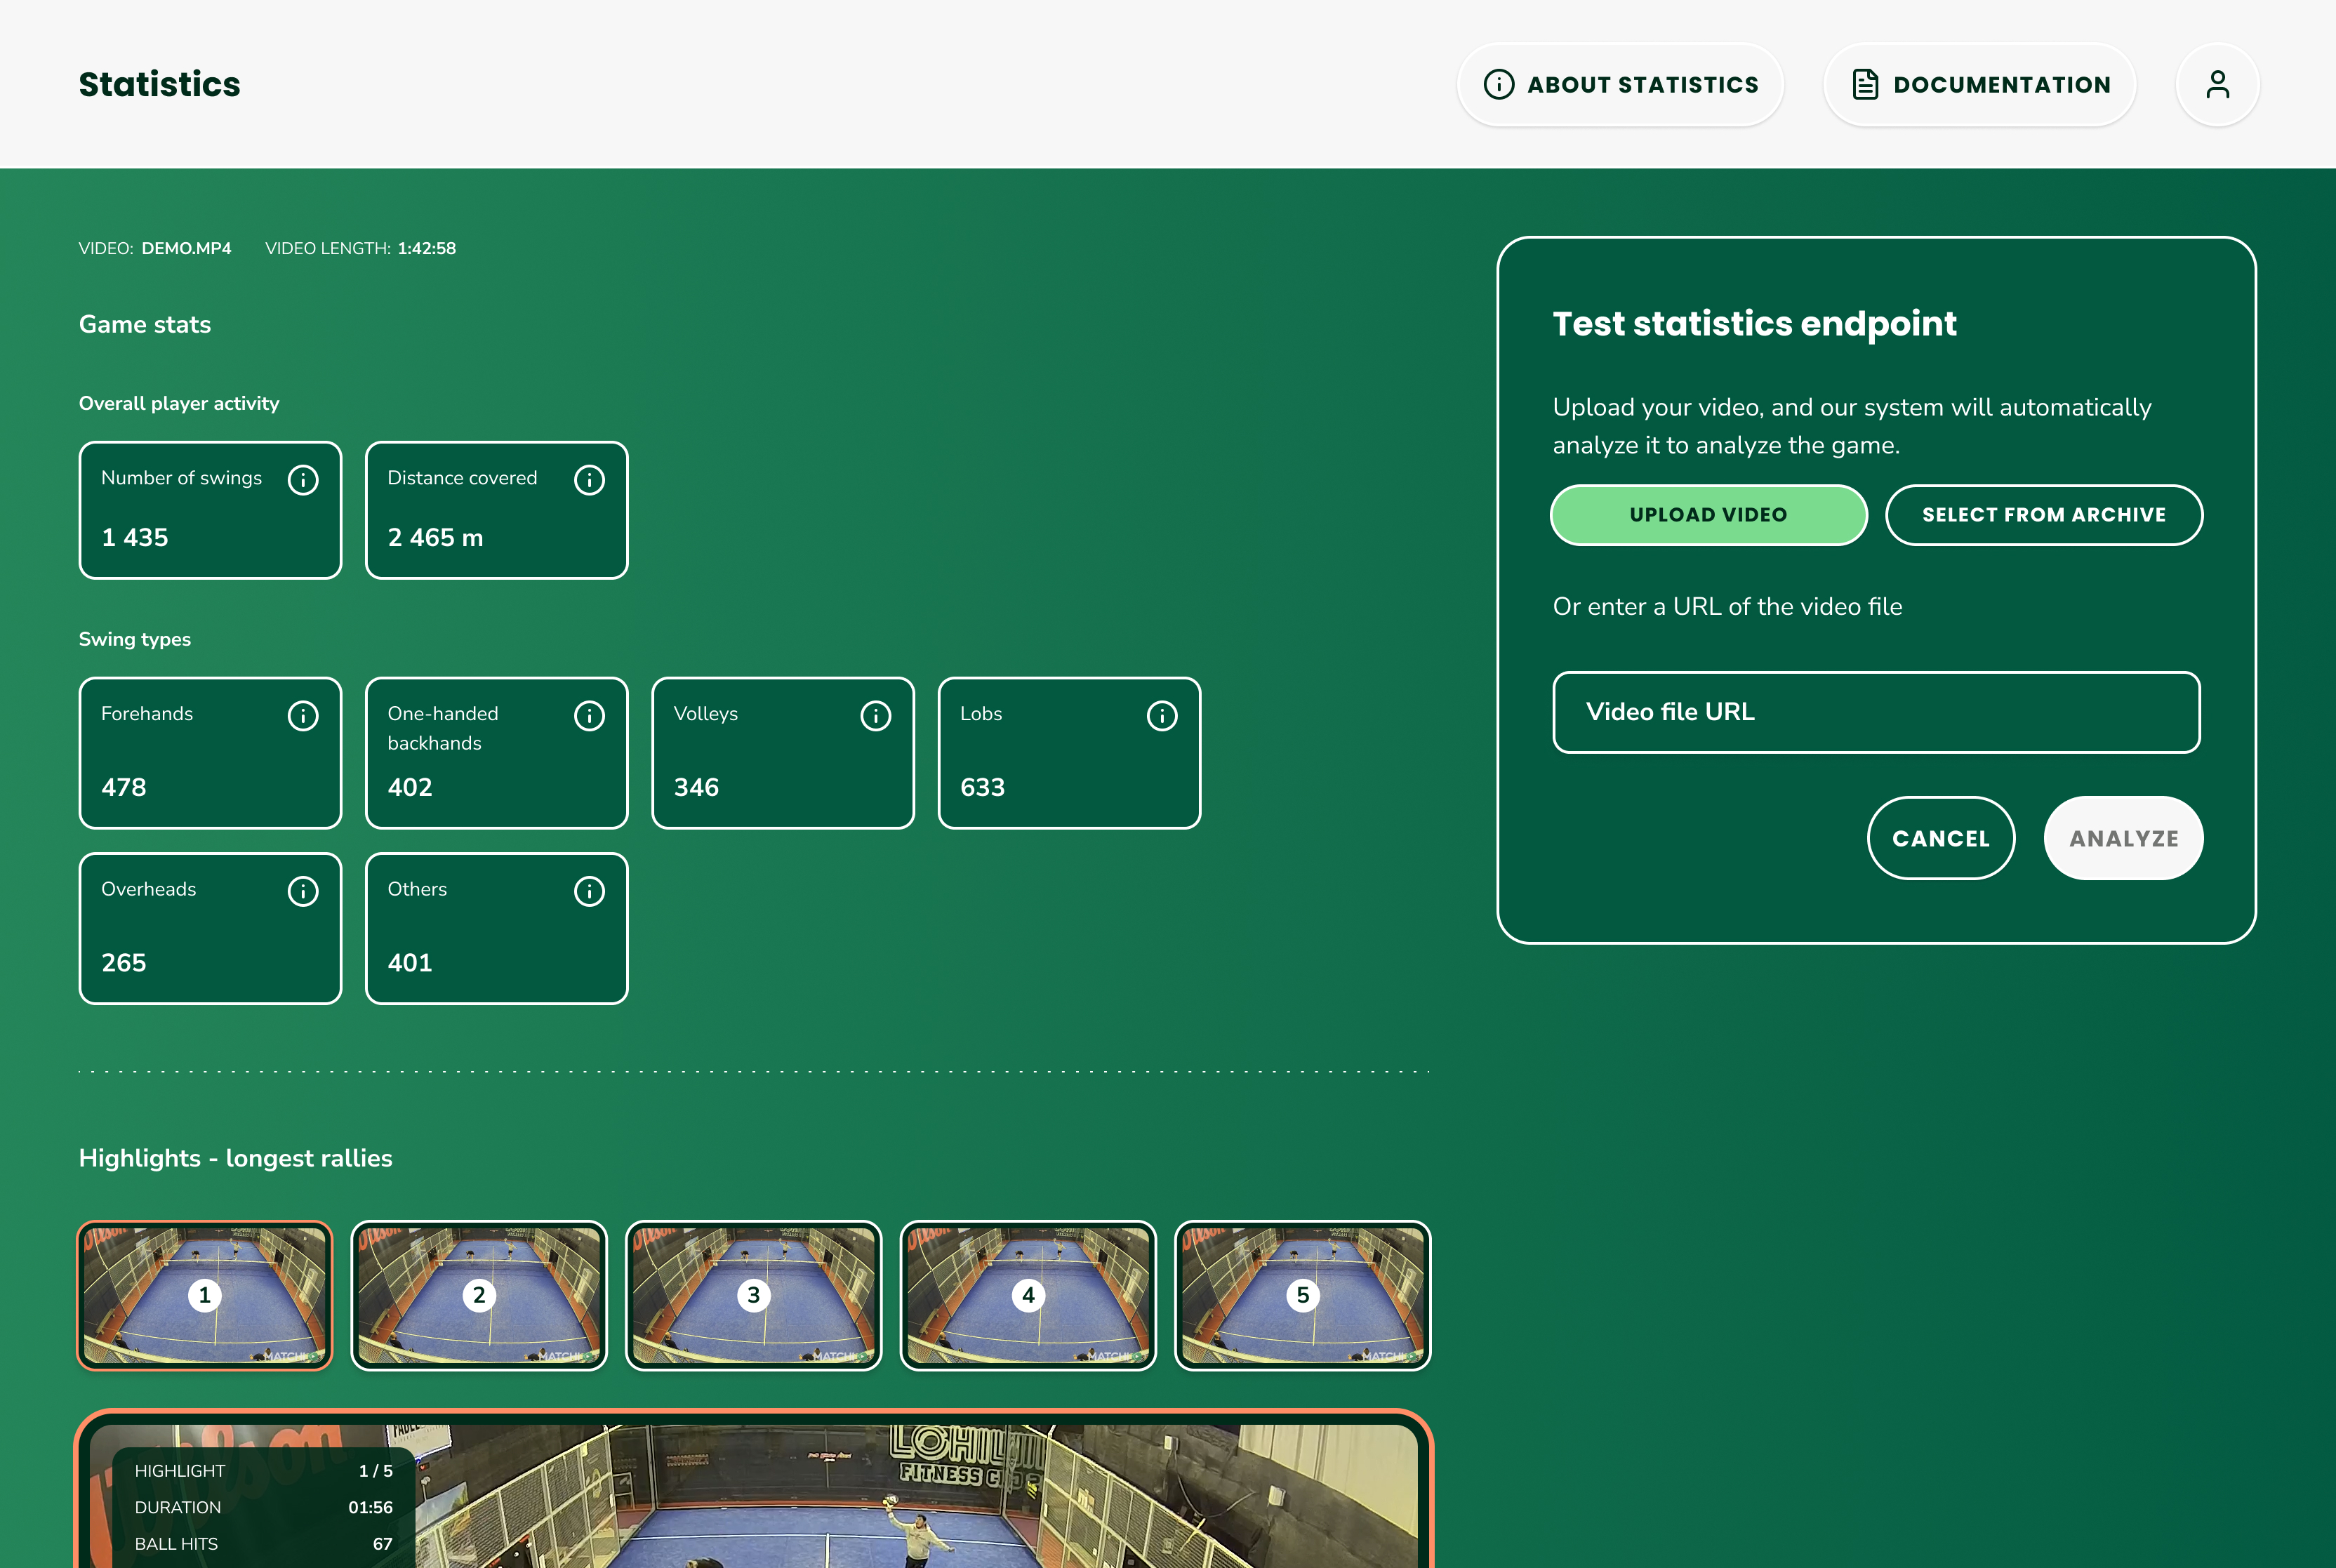
API Reference: Statistics
Get started with Statistics
Overall Pipeline
- Finding players in each video frame
- Determining pose of each player
- Tracking bounding boxes of players from frame to frame to assign player-IDs
- Post-reidentification that merges IDs for players with similar appearances
- Finding swings for each player
- Determining ball position for each frame
- Computing key statistical metrics for each player
Swings
For each player and each video-frame, the player’s pose is computed using a neural network. The pose is a collection of 17 points representing the main parts of the human body, its skeleton. Each point is given by two coordinates (x,y) defining its position on the video frame.
By analyzing the movements of player poses over consecutive video frames, we determine whether a player is performing a swing. This is done using a custom neural network trained on padel videos annotated in-house.
A swing event is defined by three time-moments (the start, the end, and the ball hit), by a swing-type and confidence. A few other properties are assigned to each swing event during subsequent analysis such as ID of the player performing the swing, the ball speed etc.
Number of Swings per Player
These values are the total number of detected swings for each player-id. The swing-types we detect:
- Forehand
- One-handed backhand
- Two-handed backhand
- Lob
- Overhead: This group contains every swing that happens above the head like smash or Bandeja
- Other: Swings which does not fall naturally into any of the above categories are classified as “other”
Swings of all types are later classified as volleys or not volleys (based on the ball trajectory), and as serves and not serves.
Swing Type Distribution
Each player's swings are counted and the % of swings falling into each category is reported as a float number between 0 and 1, resulting in the swing-type distribution.
Player Location
The court in each heatmap is divided into 250 by 500 squares, each one covering an area of 4x4 cm^2 on the court. During some period (the whole match or a highlight) the time spent by the player in each square is counted up in the corresponding cell on the location-heatmap. To account for inaccuracies in player and court locations, the neighboring cell's count is also increased with a scaled-down value. This scaling factor tapers off the further away from the main cell you get. The tapering function is based on a Gaussian kernel with a standard deviation of 6 squares (equivalent to 24 cm).
The left corner of the court furthest away from the camera has an index (0, 0) in the heatmap.
The player’s position on the court is defined as the middle point between the two player pose key points corresponding to the right foot and the left foot. It is assumed that both feet touch the floor, which is most often true.
Ball Detection
Ball detection is done by using a neural network that is custom-made for detecting smaller fast-moving objects and is trained on hundreds of padel rallies from different courts, player levels, and light settings. The current model has the following performance:
- Accuracy: 84.47%
- Precision: 90.13%
- Recall: 91.67%
These numbers are obtained for a test dataset based on videos recorded on Padel courts that were not used in the training/validation data.
An updated model is on the way and should show a higher accuracy based on training on the same data. This updated model will also be trained on more data, allowing for more robust results. It will also feature predicted values and inpainting masks for false positive filtering and better interpolation of missing detections.
Here’s a list of upcoming ball bounce detections:
- Ground
- Wall
- Net
- Hit
- Other
Ball Speed
Ball speed is defined as the peak speed of the padel ball after a player hits the ball, i.e. the starting speed. It is measured in km/h.
Thus, each swing should be assigned one value for the ball speed. For some swings, the ball speed is not delivered because ambiguity in the ball trajectory doesn’t allow accurate computation. It will improve in the next versions, especially after reliable ball bounce detection is implemented.
The ball speed model is now primarily based on 2D approach. An improved accuracy is expected when it will be extended to include 3D analysis of ball trajectory.
Highlights
Game highlights represent three-time intervals that presumably contain the most exciting rallies of the game. In addition to start-time and stop-time, they also contain basic statistics for these rallies e.g. number of swings by each player.
The highlights are currently defined as the longest rallies, i.e.the longest intervals where swings come one after another with less than 3 sec break.
Confidences
Confidence metrics for key stages of our analysis are also computed. Namely, for
- Pose computation
- Swing detection
- Ball detection
- Swing-ball correlation
All of them are provided per player and given as float numbers between 0 and 1, where 1 means the maximal confidence. The swing-ball confidence is about a padel ball being located close to a person performing a swing, which normally should be the case unless a player performs a swing movement for other purposes, without hitting the ball.
Activity Score
Activity score is a score assigned a player based on the players
- Number of swings,
- The square of the fastest sprinting speed in meters per second
- Total distance covered in meters
The score is calculated by taking these three values a point in 3D space, and projecting it down on a "reference line”. The Euclidean distance from this intersection point to the origin is defined to be the activity score.
The “reference line” is defined as the line intersecting both the origin and the point corresponding to, 10 swings, 5m/s sprint, 100 meters covered. Please note the activity score is not bounded or normalized.